Plot Spike Jitter
Arguments
- df
Data frame or Tibble, a single experiment data set with the following columns:
condition
stimulus
jitter
event_index
- group_value
Character, column name to use for grouping. Default is
"condition".- ymax
Optional integer, maximum y-value to plot in milliseconds (ms). Default is
8.- sd_value
Optional character, std deviation measurement to use, accepts "sd" or "sem". Default is
NULL.- ...
Optional vargs, to apply additional ggplot function calls, e.g.
ylim(),ylab().
Value
A ggplot2 object with the following features:
X-axis of binned events by stimulus value.
Y-axis of action potential latency (jitter) in milliseconds.
Examples
n <- 100 # sweeps
n_stim <- 2 # stimuli per sweep
conditions <- c("control", "drug_1")
n_conditions <- length(conditions)

simple_tbl <-
  data.frame(
    experiment_id = rep("example", ((n * n_stim * n_conditions))),
    condition = rep(conditions, rep((n * n_stim), n_conditions)),
    stimulus = rep(c(1:n_stim), n * n_conditions),
    jitter = rep(rnorm((n * n_stim), 2, 1), n_conditions),
    event_index = rep(1, ((n * n_stim * n_conditions)))
  )

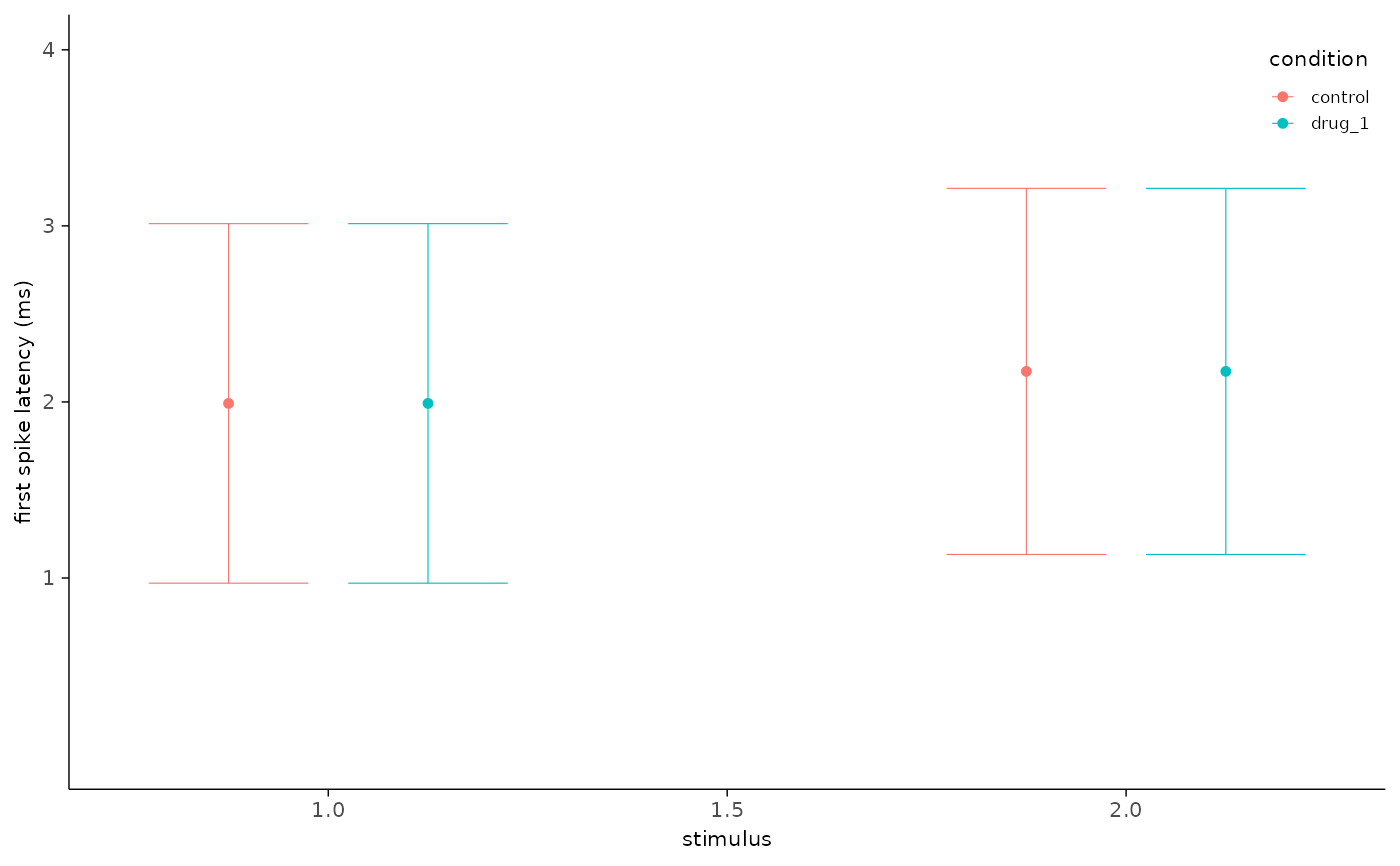
plot_jitter(
  simple_tbl,
  ymax = 4,
  sd_value = "sd"
)


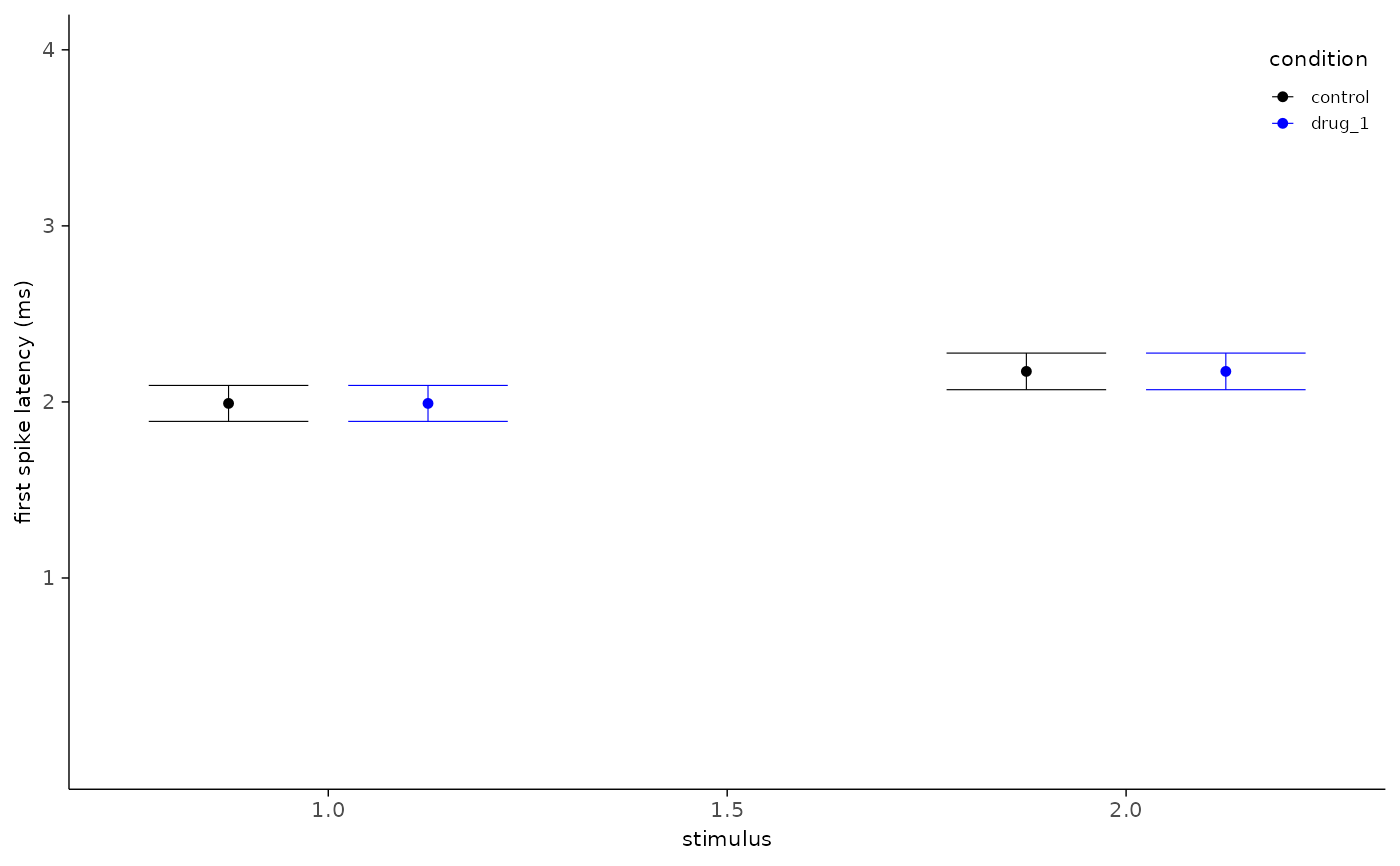
# change the default color scheme ----
plot_jitter(
  simple_tbl,
  group_value = "condition",
  ymax = 4,
  sd_value = "sem",
  ggplot2::scale_color_manual(values = c("black", "blue"))
)
