Plot Heat Map of Event Amplitudes
Arguments
- df
Data Frame or Tibble with the following columns:
sweep
amplitude
condition
stimulus
event index
- filename
Character, name of the file.
- condition_names
Character vector with condition names.
- max_amplitude
Integer, maximum value to use for the heat map. If set less than the maximum amplitude in the data frame, the value will be changed and a warning is returned. Defaults to
NULLand will automatically set the value to the df's max value.
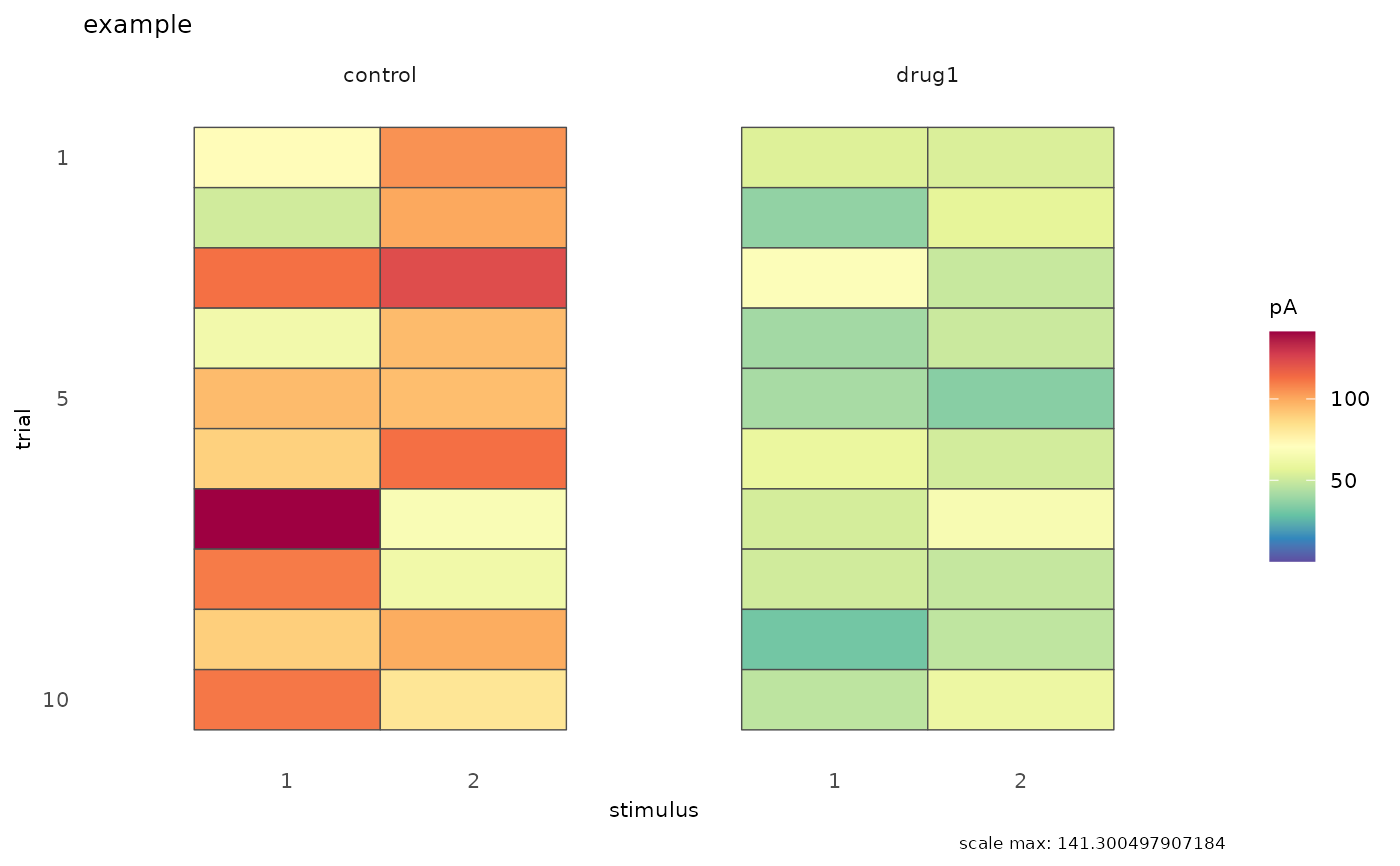
Examples
simple_df <-
  data.frame(
    sweep = rep(1:20, each = 2),
    amplitude = c(rnorm(20, 100, 20), rnorm(20, 50, 10)),
    condition = rep(c("control", "drug1"), rep(20, 2)),
    stimulus = rep(c(1:2), 20),
    event_index = rep(1, 40)
  )

plot_heatmap(
  df = simple_df,
  filename = "example",
  condition_names = c("control", "drug1")
)
#> Warning: plot_heatmap() 'max_amplitude' is NOT defined; 'max_amplitude' set to: 141.300497907184